FIFA World Cup 2026 Streaming Analytics
This project demonstrates a complete Kafka streaming analytics pipeline using completed FIFA World Cup 2026 match results.
The original example processed sales transactions. My custom project applies the same streaming techniques to international football match data.
The producer reads completed matches from a CSV file and sends them to Kafka one record at a time. The consumer validates each match, calculates derived fields, updates team statistics and group standings, writes output files, stores the results in DuckDB, and generates a visualization.
Project Overview
The pipeline follows this workflow:
World Cup CSV
      ↓
Kafka Producer
      ↓
Kafka Topic
      ↓
Kafka Consumer
      ↓
Validation and Analytics
      ↓
CSV + DuckDB + Visualization
The project analyzes:
- matches played
- wins, draws, and losses
- goals scored and conceded
- goal difference
- points
- winning percentage
- current group rankings
Key Visualization
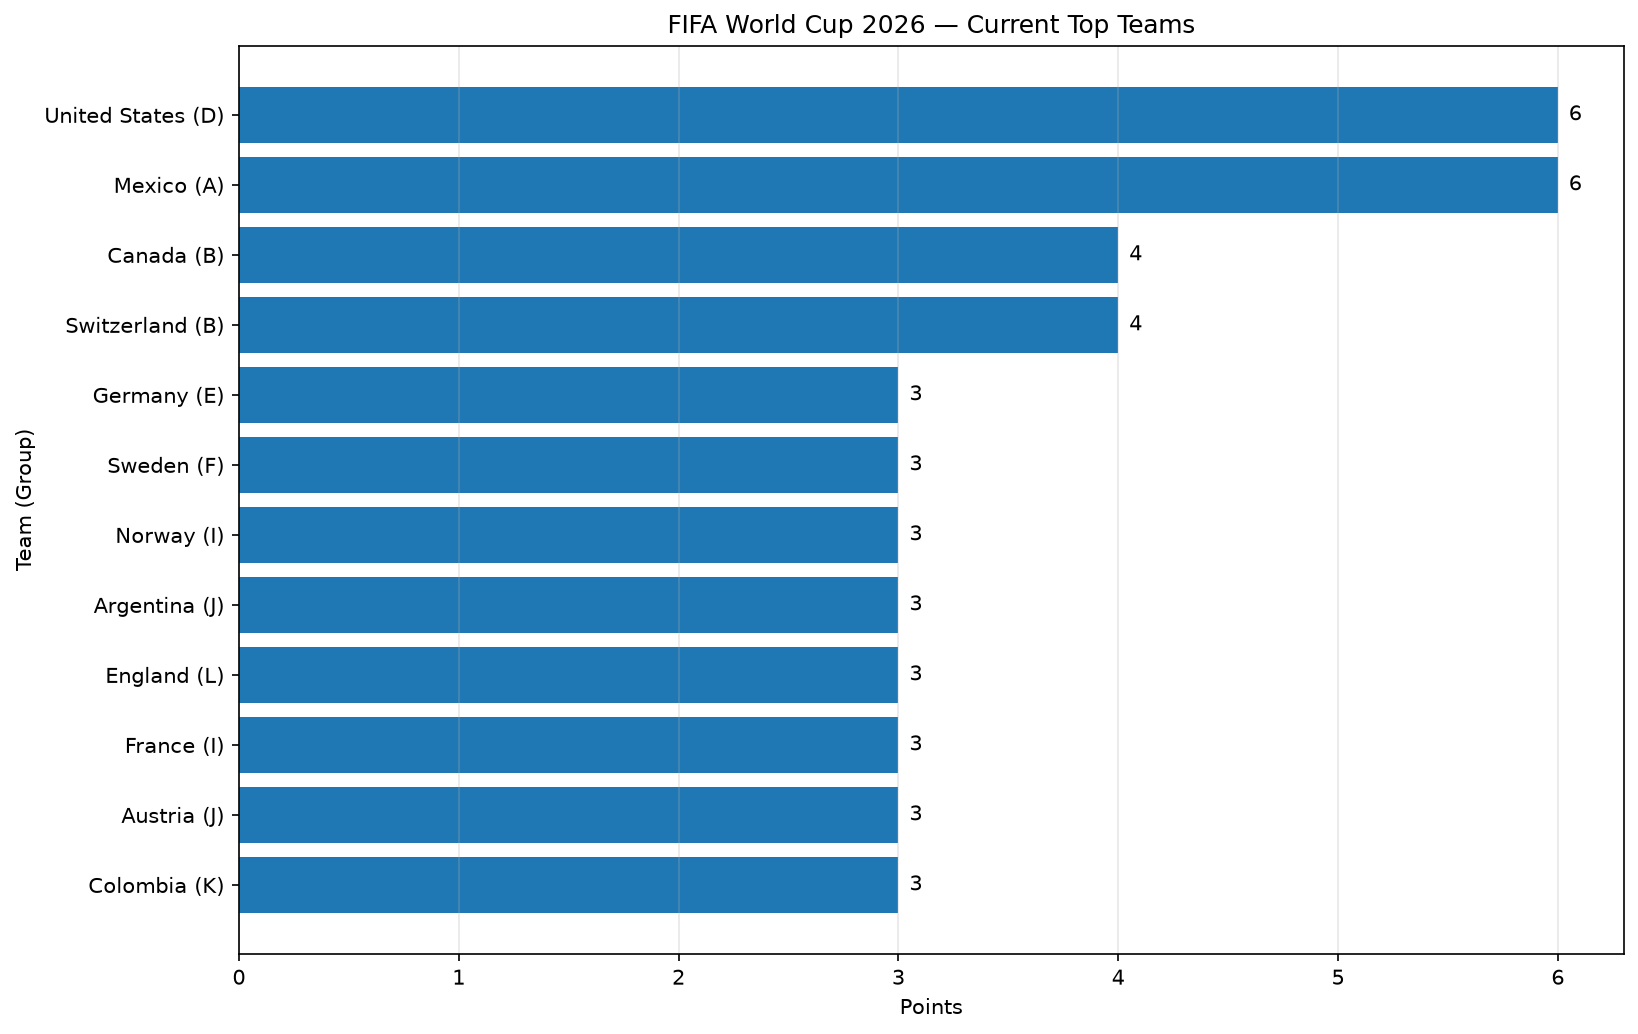
The following chart shows the leading teams based on the matches processed by the Kafka consumer.
Output Files
The completed pipeline generates the following artifacts:
data/output/consumed_world_cup_matches.csvdata/output/world_cup_team_standings.csvdata/output/world_cup.duckdbdata/output/world_cup_team_standings.png
Custom Project
Dataset
The Kafka producer uses the dataset:
The file contains 29 completed FIFA World Cup 2026 matches available at the dataset cutoff time.
Each row represents one completed match and includes fields such as:
match_idmatch_datestagematchdaygrouphome_team_codehome_teamaway_team_codeaway_teamhome_goalsaway_goalswinnerresult_typetotal_goalshome_pointsaway_pointsfifa_venue_namecommon_stadium_namecityhost_countrysource_urldataset_cutoff
The dataset was created from completed World Cup match results published on the official FIFA scores and fixtures page.
I replaced the original sales dataset with a new football dataset. The sales, product, currency, discount, and regional fields are not used by the custom producer or consumer.
Reproducibility Note
This project uses a fixed CSV snapshot rather than a live FIFA API connection.
The results reflect the completed matches available at the value recorded in
the dataset_cutoff field.
Using a fixed snapshot makes the project reproducible. Running the producer with the same CSV file should generate the same 29 Kafka messages and the same final standings.
To analyze additional matches, update data/world_cup_matches.csv while
preserving the required columns and unique match IDs.
Kafka Messages
The custom producer is:
The producer reads one completed match at a time from
world_cup_matches.csv, validates the record, and sends it to Kafka as a
dictionary message.
The Kafka topic is:
The message key is the World Cup group letter, such as A, B, or J.
Using the group as the key keeps matches from the same group logically
associated.
The message fields were completely changed from the original sales example. Instead of sending order IDs, products, regions, quantities, and prices, the producer sends teams, scores, match information, points, venue information, and result fields.
The producer also checks:
- required fields
- valid ISO dates
- nonnegative goal values
- correct total-goal calculations
- correct winner values
- correct result types
- correct points
- duplicate match IDs
Invalid records are written to:
During the successful run, the producer sent 29 messages and rejected zero records.
Consumer Processing
The custom consumer is:
The consumer receives completed World Cup match messages from Kafka and reads the topic from the beginning.
For each message, the consumer:
- validates all required match fields
- converts numeric fields to integers
- creates a readable scoreline
- calculates the winning margin
- identifies whether the match was a draw
- updates statistics for both teams
- recalculates group rankings
- updates the visualization
- writes the processed match to CSV
- writes the match and standings to DuckDB
The consumer calculates these statistics for every team:
- matches played
- wins
- draws
- losses
- goals for
- goals against
- goal difference
- points
- win percentage
- position within the group
The consumer logs information such as:
- match scoreline
- group
- winner
- goals in the match
- number of consumed messages
- total goals
- average goals per match
- home wins
- away wins
- draws
- current group leaders
The consumer processed 29 valid match messages and skipped zero messages.
Processed match records are written to:
Updated team rankings are written to:
The consumer stores two tables in world_cup.duckdb:
matchesteam_standings
Experiments
Phase 4 Modification
For Phase 4, I replaced the original high-value sales detection logic with World Cup match validation and football analytics.
The original project calculated sales totals and identified orders worth at least $150. My modification changed the producer and consumer to work with football results instead.
I added validation rules that verify the relationship between:
- home and away goals
- winner
- result type
- total goals
- points awarded
This modification ensures that inconsistent match results are rejected before they are included in the analytics.
Phase 5 Application
For Phase 5, I developed a live team standings application.
After every consumed match, the application updates statistics for both teams and recalculates their group positions.
Teams are ranked using:
- points
- goal difference
- goals scored
- team name as a final deterministic tie breaker
The application writes current standings to CSV and DuckDB and updates a horizontal bar chart showing leading teams.
This transformed the example from a sales-processing pipeline into a complete sports analytics application.
Results
The producer successfully sent:
The producer rejected:
The consumer successfully consumed:
The consumer skipped:
The resulting standings contain 48 national teams across 12 groups.
Examples of findings from the processed matches include:
| Finding | Result |
|---|---|
| Mexico points | 6 |
| United States points | 6 |
| Canada goals scored | 7 |
| Germany goals scored | 7 |
| Canada goal difference | +6 |
| Germany goal difference | +6 |
| Mexico win percentage | 100% |
| United States win percentage | 100% |
Mexico led Group A with two wins from two matches. The United States led Group D with two wins. Canada and Switzerland both earned four points in Group B, with Canada ranked first because of its stronger goal difference.
Interpretation
The original example streamed sales transactions and calculated financial values. My version streams football match results and calculates competitive performance statistics.
Watching the messages move through Kafka demonstrated how a completed sporting event can become an individual streaming message. The consumer does not need to wait for the entire dataset before producing insights. After every match, the rankings, statistics, database, CSV output, and chart can be updated.
This workflow could help a sports organization, broadcaster, analyst, or tournament operator monitor:
- team performance
- group leaders
- scoring strength
- defensive performance
- qualification position
- changes in standings after each match
The consumed messages provided business intelligence by converting individual match results into structured tournament-level insights. Instead of examining each score manually, users can immediately compare teams and identify leaders, top-scoring teams, strong defenses, and teams at risk of elimination.
How to Run the Project
Start Kafka and create the project topic before running the Python files.
Run the custom producer:
Run the custom consumer:
Run the quality checks:
uv run ruff format .
uv run ruff check . --fix
uv run python -m pyright
uv run python -m pytest
uv run python -m zensical build
Project Documentation Pages
- Home - project overview, results, and interpretation
- Project Instructions - module-specific instructions
- Your Files - guidance for creating custom project files
- Glossary - streaming data concepts
- API - autogenerated code documentation